
Checkout A/B Testing for Skincare Brands
What skincare brands should A/B test first, what beauty brands have tested, how much traffic a test needs at beauty conversion rates, and what to avoid.

Article summary
TL;DR
Skincare brands should test what shoppers hesitate on first: the default routine kit, proof near the add-to-cart button, the cart experience and the checkout. At the 2.74% median beauty conversion rate, detecting a 20% lift takes about 15,000 visitors per version. Pick winners on contribution per visitor, and wait for reorders before judging subscription and kit tests.
- Shopify beauty brands convert at 2.74% at the median (Polar, August 2026).
- A product-tagged grid raised Lumen Skincare's AOV by 18%, from £64.20 to £75.80, over 14 days and 11,300 sessions, according to the vendor's case study.
- Cart and checkout tests added about $1.6M of revenue for Kiehl's, according to the agency SplitBase.
- Beauty has the highest cart abandonment in Dynamic Yield's data (79.94%), so the cart is a prime test area.
- One A/B vendor says a standard test needs three to four weeks on typical DTC traffic.
 ChatGPT
 Claude
 Perplexity
 Grok
On this page
This guide is part of our playbook on the best ecommerce platform for skincare brands. For the checkout itself: checkout optimization for skincare brands.
What to test first
| Priority | Test | A vs. B | Decide on |
|---|---|---|---|
| 1 | Default kit | Single product vs. 3-step routine highlighted | Contribution per visitor |
| 2 | Proof near the button | Reviews, certifications below the fold vs. next to add-to-cart4Shoplift, 5 skincare A/B tests to run before summer traffic hits, April 22, 2026 (vendor) | Add-to-cart rate |
| 3 | Cart experience | Cart page vs. slide-out cart with routine suggestions | Cart to checkout rate |
| 4 | Order bump | None vs. a mini or refill | AOV, bump take rate |
| 5 | One-click upsell | Next routine step vs. bigger size | Upsell take rate |
| 6 | Subscription presentation | One-time first vs. routine subscription first, terms equally clear | 90-day revenue |
| 7 | Express payment | Card form only vs. Apple Pay and Google Pay on top | Mobile completion |
Fig. 1Seven tests, in the order to run them
- Default kit: single product vs. 3-step routine highlighted.
- Proof near the button: reviews and certifications next to add-to-cart.
- Cart experience: cart page vs. slide-out cart with routine suggestions.
- Order bump: none vs. a mini or refill.
- One-click upsell: next routine step vs. bigger size.
- Subscription presentation: one-time first vs. routine subscription first, terms equally clear.
- Express payment: card form only vs. Apple Pay and Google Pay on top.
Decide each test on the metric in the table: contribution per visitor, add-to-cart, cart to checkout, AOV, take rate, 90-day revenue, mobile completion.
Start with what changes the basket, not the button color.
What beauty brands have tested
| Brand | Test | Reported result | Source |
|---|---|---|---|
| Lumen Skincare | Product-tagged grid on the homepage | AOV +18% (£64.20 to £75.80), 14 days, 11,300 sessions, 95% confidence | Idukki case study2Idukki, Lumen Skincare case study, read October 26, 2026 (vendor) |
| Kiehl's | Cart and checkout changes | Abandonment down at every checkout step, about $1.6M added revenue | SplitBase case study3SplitBase, Kiehl's case study, read October 26, 2026 (agency) |
Vendor and agency case studies: useful as ideas, not as benchmarks.
+18%
Lumen Skincare AOV after a product-tagged grid, per the vendor's case study
£75.80
Lumen Skincare AOV after the test, up from £64.20, over 11,300 sessions
$1.6M
Added revenue SplitBase reports for Kiehl's cart and checkout tests
79.94%
Beauty cart abandonment, the highest in Dynamic Yield's data
Beauty has the highest cart abandonment in Dynamic Yield's data (79.94%), so the cart is a prime test area.5Dynamic Yield (Mastercard), Ecommerce benchmarks for beauty, read October 12, 2026
How much traffic you need
Standard two-proportion calculation at 95% confidence and 80% power, from the 2.74% median beauty conversion rate1Polar Analytics, Weekly ecommerce benchmarks, Beauty & Personal Care, updated August 25, 2026.
| Lift to detect | Visitors per version | Days at 1,000 visitors a day (two versions) |
|---|---|---|
| +10% | about 58,400 | about 117 |
| +20% | about 15,300 | about 31 |
| +30% | about 7,100 | about 15 |
Computed figures; use your own conversion rate.
Fig. 2Visitors needed per version, by lift to detect
Halve the lift you want to see, and the traffic you need roughly quadruples.
- Test big changes, like the default kit, not button colors.
- Run at least three to four weeks on typical traffic, as one vendor advises4Shoplift, 5 skincare A/B tests to run before summer traffic hits, April 22, 2026 (vendor), and through a full pay cycle.
- Skip big sale periods unless you're testing them.
Measure the right thing
| Metric | Why |
|---|---|
| Conversion rate | More buyers? |
| AOV | Bigger orders? |
| Contribution per visitor | More money after product, shipping and discounts? |
| 90-day repeat or renewal | For kits and subscriptions, did they come back? |
| Returns and refunds | Did a winning variant bring unhappy buyers? |
Example (illustrative): version B highlights the 3-step routine. Conversion drops from 2.8% to 2.5%, AOV rises from $52 to $88. Contribution per visitor goes up, so B wins.
Fig. 3Same test, read two ways
Version A: single product
- Conversion2.8%
- thenAOV$52
Higher conversion, less money per visitor
Version B: 3-step routine
- Conversion2.5%
- thenAOV$88Approved
Contribution per visitor goes up, B wins
On conversion alone, the losing version wins.
Tests that touch the rules
| Avoid testing | Why |
|---|---|
| A "was" price you never charged | Former prices must be real and regular616 CFR 233.1, Former price comparisons |
| Subscription terms below the button or pre-checked | Clear terms and express consent are required7Restore Online Shoppers' Confidence Act, 15 U.S.C. § 8403 |
| Wrinkle before-and-after on TikTok traffic | Not allowedBy TikTok8TikTok Ads Policy, Misleading and false content, updated September 2025 |
| Treatment claims ("clears acne") vs. cosmetic claims | The "winning" claim may make the product a drug |
Real former prices only
A "was" price must be one you actually charged616 CFR 233.1, Former price comparisons.
Terms above the button
Subscription terms stay clear and consent is never pre-checked7Restore Online Shoppers' Confidence Act, 15 U.S.C. § 8403.
No wrinkle before-and-after
TikTok does not allow them in ads8TikTok Ads Policy, Misleading and false content, updated September 2025.
Cosmetic claims only
A treatment claim that "wins" may make the product a drug.
How Tagada helps
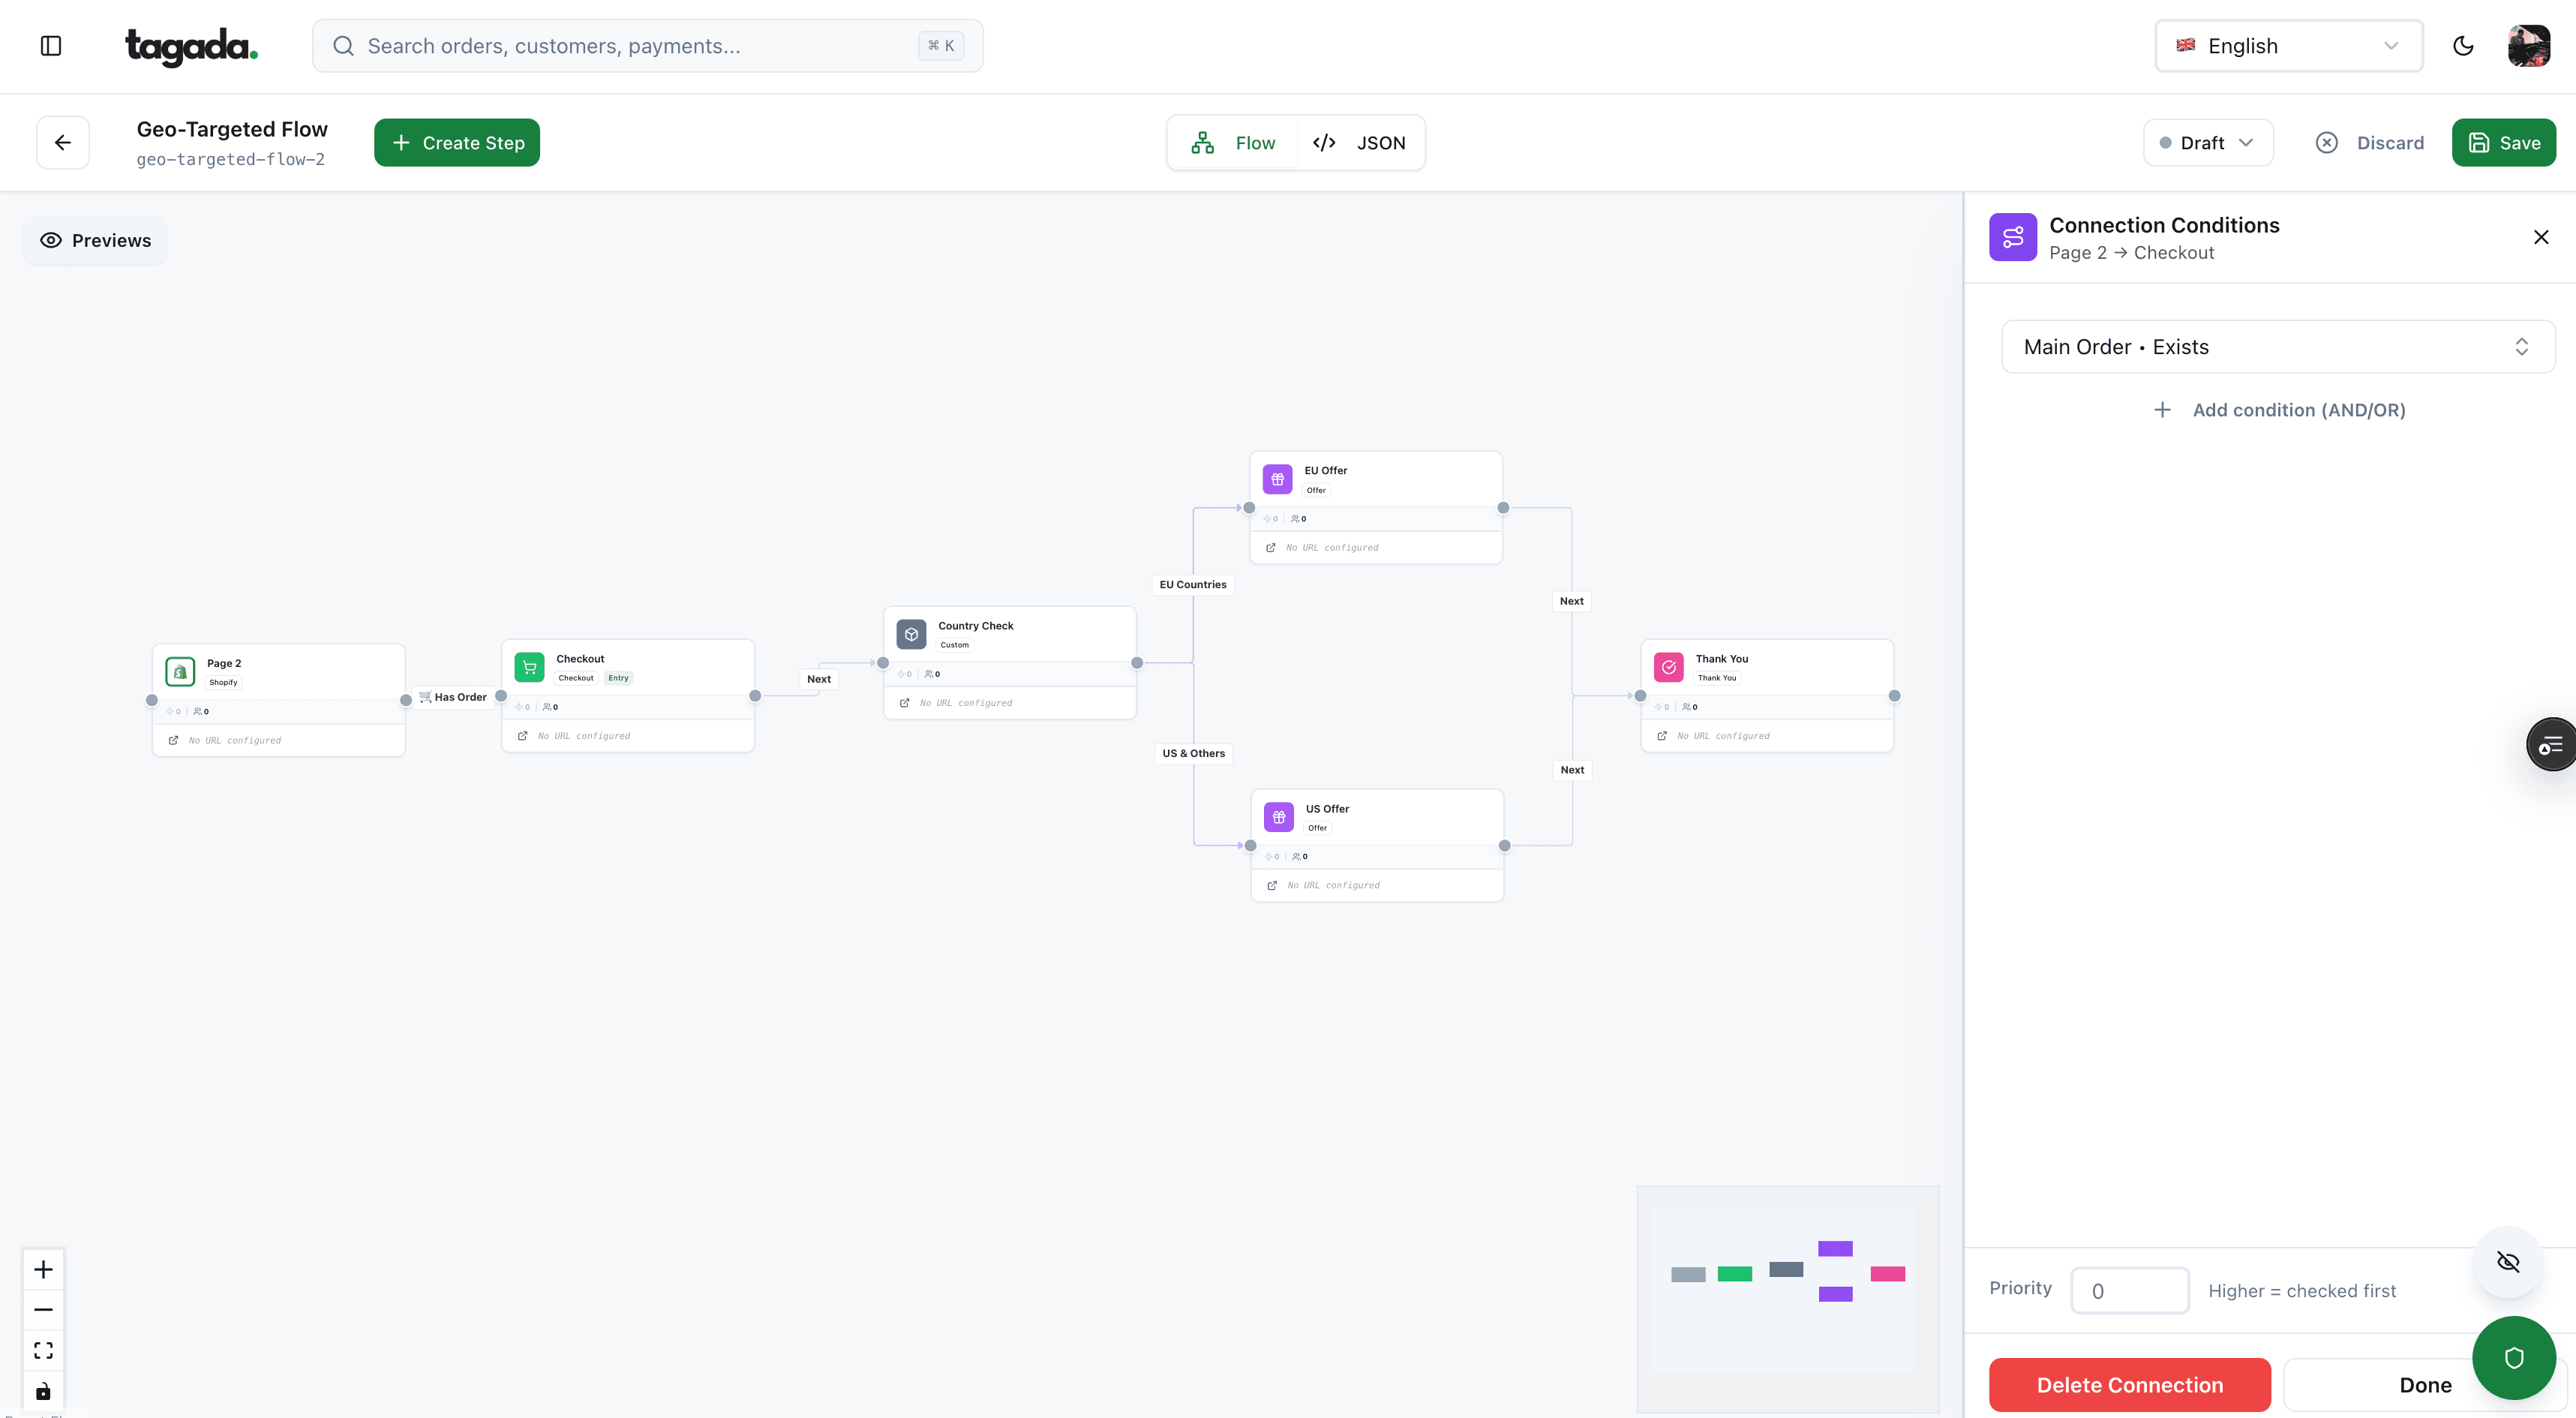
Test kits, bumps and checkout on one stack
- A/B tests on offers, kits and checkout
- Order bumps and one-click upsells to test what buyers add
- Subscriptions with trials, cycles and retries, to test routine subscriptions
- Apple Pay and Google Pay to test express payment
- Server-side tracking so each version's purchases are counted once
Plans are on the pricing page.
Frequently asked questions
What should a skincare brand A/B test first?
How long should a skincare A/B test run?
Can small skincare brands run A/B tests?
Should I judge tests on conversion rate?
Sources
Checked October 26, 2026- Polar Analytics, Weekly ecommerce benchmarks, Beauty & Personal Care, updated August 25, 2026
- Idukki, Lumen Skincare case study, read October 26, 2026 (vendor)
- SplitBase, Kiehl's case study, read October 26, 2026 (agency)
- Shoplift, 5 skincare A/B tests to run before summer traffic hits, April 22, 2026 (vendor)
- Dynamic Yield (Mastercard), Ecommerce benchmarks for beauty, read October 12, 2026
- 16 CFR 233.1, Former price comparisons
- Restore Online Shoppers' Confidence Act, 15 U.S.C. § 8403
- TikTok Ads Policy, Misleading and false content, updated September 2025
Tagada
Test the offers that change what skincare shoppers buy
Funnels, one-click upsells, subscription billing and payment routing, on one customer record.
- 01Create your free account
- 02Connect your store or build a checkout
- 03Launch funnels, upsells and subscriptions