
Most ecommerce teams treat upsell rate as a scoreboard. That's a mistake. A single percentage can look healthy while refunds, payment failures, chargebacks, discounts, and subscription cancellations erase the value behind it.
The operator-grade view is different. Track six connected metrics: gross acceptance rate, net upsell revenue per eligible order, incremental contribution margin, refund-adjusted revenue, chargeback-adjusted revenue, and retention-adjusted lifetime value. The first tells you whether buyers accept an offer. The rest tell you whether that acceptance deserves to scale.
That distinction matters across DTC, subscription, creator, international, and high-risk businesses. An order bump, a one-click post-purchase offer, a plan upgrade, and a rebill message reach customers with different intent and different economics. Blending them creates a number that's easy to report and difficult to trust.
Why Upsell Rate Deserves a Reset
The most misleading number in ecommerce reporting is often the headline upsell percentage. It rewards the offer that gets the most clicks or accepts, even when that offer carries weak margin, creates extra support work, fails at payment capture, or increases refunds.
A useful upsell rate starts with a narrow question: how many completed primary purchasers accepted an eligible upgrade? It then connects that acceptance to the money that remains after discounts, processing costs, refunds, fulfillment, disputes, and retention outcomes.
Operator rule: Acceptance is an event. Profit is the verdict.
For Tagada's audiences, the difference is practical. A DTC brand may offer a larger quantity. A creator may offer a premium course bundle. A subscription merchant may move a customer to a higher tier. A high-risk operator may add a recurring product after the original transaction. Those offers shouldn't share one blended benchmark because they don't share one risk profile or customer journey.
The six-metric replacement
Use this sequence instead of one vanity percentage:
- Gross acceptance rate, the share of eligible primary orders accepting at least one upsell.
- Net upsell revenue per eligible order, upsell revenue minus upsell refunds, divided by eligible primary orders.
- Incremental contribution margin, revenue after product costs, discounts, payment costs, fulfillment, refunds, and support costs.
- Refund-adjusted revenue, which removes revenue later returned to the customer.
- Chargeback-adjusted revenue, which accounts for disputed transactions and associated losses.
- Retention-adjusted lifetime value, which tests whether the offer supports or damages future customer value.
This framework separates merchandising performance from payment performance. It also makes comparisons fairer across checkout bumps, post-purchase flows, lifecycle messages, devices, countries, and subscription cohorts.

Upsell Rate Definition and Core Formula
Define upsell rate as the percentage of completed primary purchases that accept at least one higher-tier, larger-quantity, or otherwise upgraded offer during or immediately after the transaction.
Upsell rate = orders accepting at least one upsell ÷ eligible primary orders × 100
The denominator excludes visitors who never purchased. Fix it before testing. If one team uses offer impressions and another uses completed orders, both can report accurate calculations and still produce numbers that can't be compared.
An upsell increases the value or tier of the original purchase. A cross-sell adds a different complementary product. A larger pack is an upsell. A separate accessory is usually a cross-sell. Record acceptance only after the additional payment is authorized and captured, not merely after a button click.
For financial reporting, use:
Net upsell revenue per eligible order = upsell revenue minus upsell refunds ÷ eligible primary orders
The parentheses matter in implementation. Calculate the refund-adjusted numerator first, then divide by the fixed eligible-order denominator.
| Denominator | What it measures | When it works | When it breaks |
|---|---|---|---|
| Eligible primary orders | Accepted upsells among completed purchasers | Executive reporting and controlled tests | It excludes pre-purchase friction before the offer appears |
| Completed sessions | Accepted offers relative to completed checkout sessions | Funnel diagnostics | Session definitions vary by device and analytics tool |
| Offer impressions | Acceptance among people shown an offer | Creative and placement analysis | It can make weak traffic or selective exposure look better |
| Payment-captured orders | Accepted offers tied to captured payment | Revenue reconciliation | It can understate exposure and acceptance when payment completion fails |
Different denominators answer different questions. They aren't interchangeable. For broader measurement context, conversion optimization benchmark insights are useful, but an upsell report still needs its own eligibility and payment rules.
Tagada merchants should instrument offer exposure, acceptance, decline, cancellation, refund, device, traffic source, payment method, and subscription status as server-side events. That structure lets finance defend the denominator and lets growth teams diagnose whether a weak result comes from the offer, the audience, or the payment path.
Benchmarks by Vertical and Offer Mechanism
There is no universal good upsell rate. Available benchmark data varies by business model, funnel position, traffic source, and denominator.
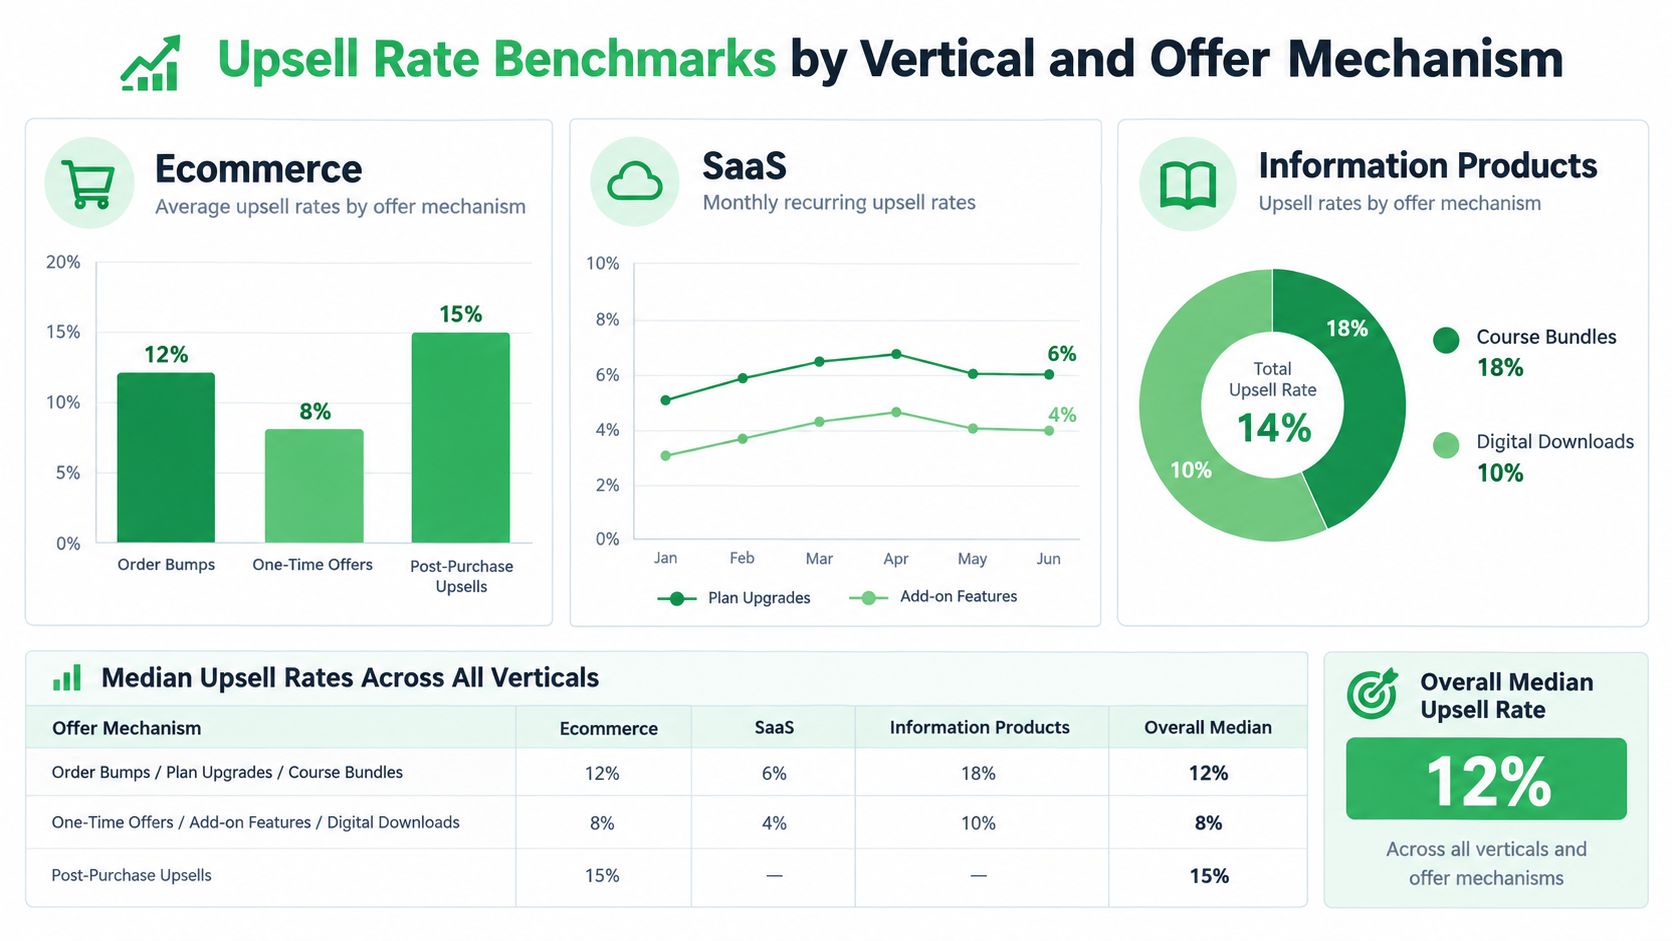
One benchmark dataset reports average upsells of 18.7% for physical ecommerce products, 27.6% for SaaS, and 31.2% for information products (benchmark source). The same dataset places top-quartile ecommerce performers at approximately 29.4%, so the gap between an average merchant and a strong operator can exceed 10 percentage points. These figures shouldn't become universal targets because they combine different offer mechanics and definitions.
The same source reports 37.8% for order bumps, 23.4% for one-time offers, 14.6% for post-purchase upsells, and 11.3% for email-sequence upsells. That spread alone proves why placement-level reporting matters. An order bump shown at checkout isn't comparable with a lifecycle offer delivered after the customer leaves.
Compare like with like
A separate benchmark compilation reports directional ranges of 1% to 4% for checkout offers, 2% to 5% for cart-drawer recommendations, 3% to 8% for one-click post-purchase offers, and 1% to 3% for product-page recommendations (funnel benchmark compilation). It also reports automated targeting at 3.8% on average compared with 1.56% for manually curated offers.
Those ranges aren't directly comparable with purchaser-based acceptance rates. One may use impressions or sessions as the denominator, while another measures acceptance among primary purchasers. Tagada operators should therefore report separate rows for checkout bumps, cart recommendations, post-purchase offers, subscription upgrades, and email or SMS offers.
Use benchmarks as directional diagnostics, not promises. First match the mechanism and denominator. Then compare acceptance with incremental margin, payment completion, refunds, disputes, and retention.
Server-Side Event Tracking for Upsell Attribution
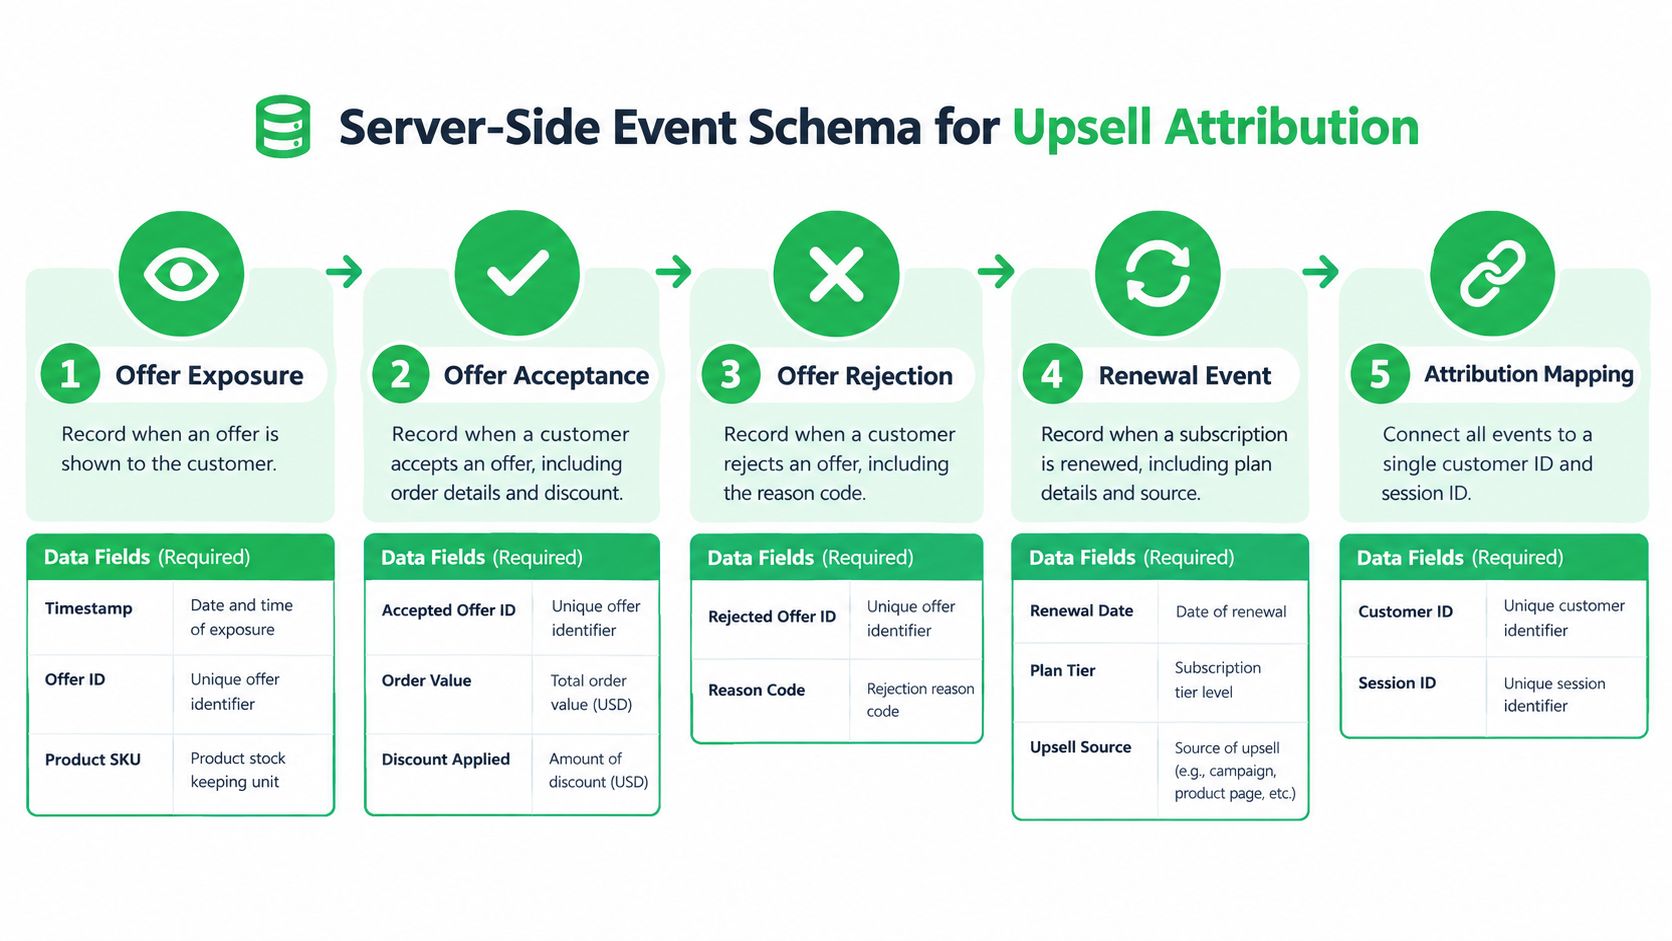
A credible upsell report begins with an event chain, not a dashboard widget. Every event needs a stable customer ID, order ID, session ID, offer ID, timestamp, product SKU, country, device, traffic source, payment method, and subscription status where relevant.
The minimum event schema
Record these events separately:
- Offer exposure: offer ID, placement, timestamp, product SKU, customer ID, session ID, device, country, and traffic source.
- Offer acceptance: accepted offer ID, primary order ID, upsell order value, discount applied, payment method, and customer status.
- Offer decline: rejected offer ID, decline reason code, placement, and session context.
- Authorization and capture: processor, payment method, authorization result, capture result, failure reason, retry status, and captured amount.
- Refund and cancellation: refund amount, refund timestamp, reason, product, subscription status, and originating offer.
- Chargeback: dispute status, dispute amount, reason category, offer ID, original product, traffic source, and renewal date.
- Subscription lifecycle: plan tier, billing interval, consent event, rebill result, cancellation request, and retention state.
The event chain should follow the customer from impression through payment capture and, for subscriptions, through renewal. That prevents a front-end click from being mistaken for collected revenue.
Client-side pixels remain useful for ad platforms, but browser events can be blocked, delayed, duplicated, or lost during redirects. Reconcile them against server-side payment truth. A practical PledgeBox conversion tracking guide can help teams think through conversion event design, while Tagada's server-side tracking setup provides a relevant implementation reference.
Reconciliation rules
Tagada merchants should treat the captured payment as the financial source of truth. Use the client event for marketing attribution, then reconcile it to the server event by order ID, customer ID, session ID, and offer ID.
TagadaStudio and TagadaPay can support the funnel and payment layers, while TagadaSend can trigger lifecycle messages from confirmed payment events. The key rule is operational: don't send a rebill or upsell follow-up because a browser pixel fired. Send it because the server confirmed the transaction and its status.
Choosing the Right Measurement Approach
The correct denominator depends on the question, but the default for executive reporting should be eligible primary orders. It survives changes in traffic mix better than a visitor denominator and makes the relationship between original purchases and accepted offers explicit.
| Approach | Statistical power | Period comparability | Main weakness |
|---|---|---|---|
| Per eligible offer | Strong for a specific offer | Good when eligibility stays fixed | Misses customers excluded from exposure |
| Per purchaser | Strong for post-purchase analysis | Good across purchaser cohorts | Doesn't describe pre-purchase reach |
| Per session | Useful for funnel diagnostics | Sensitive to session definitions | Mixes device and traffic behavior |
| Per visitor | Useful for total funnel economics | Sensitive to acquisition mix | Dilutes offer performance with nonbuyers |
Impression-based reporting can inflate a placement when only high-intent shoppers see the offer. Session-based reporting can hide mobile friction by blending sessions with very different checkout behavior. Visitor-based reporting is valuable for net revenue per visitor, but it shouldn't replace the purchaser-based upsell rate.
Use a randomized holdout
Randomize eligible purchasers into treatment and control. The treatment sees the upsell. The control follows the same primary purchase path without the offer. Compare incremental paid revenue and contribution margin, not just the treatment group's acceptance rate.
This is the cleanest way to identify whether the offer created additional value or merely captured purchases that would have happened anyway. Segment results by device, traffic source, country, payment method, and subscription cohort.
CFO-ready default: Report eligible-order acceptance, then optimize incremental contribution margin per original checkout against a randomized holdout.
The Monday founder report should show the six-metric framework, treatment-versus-control lift, and guardrail outcomes. If the offer increases acceptance but lowers primary checkout conversion or raises refund exposure, it hasn't won.
Optimization Tactics Across the Funnel
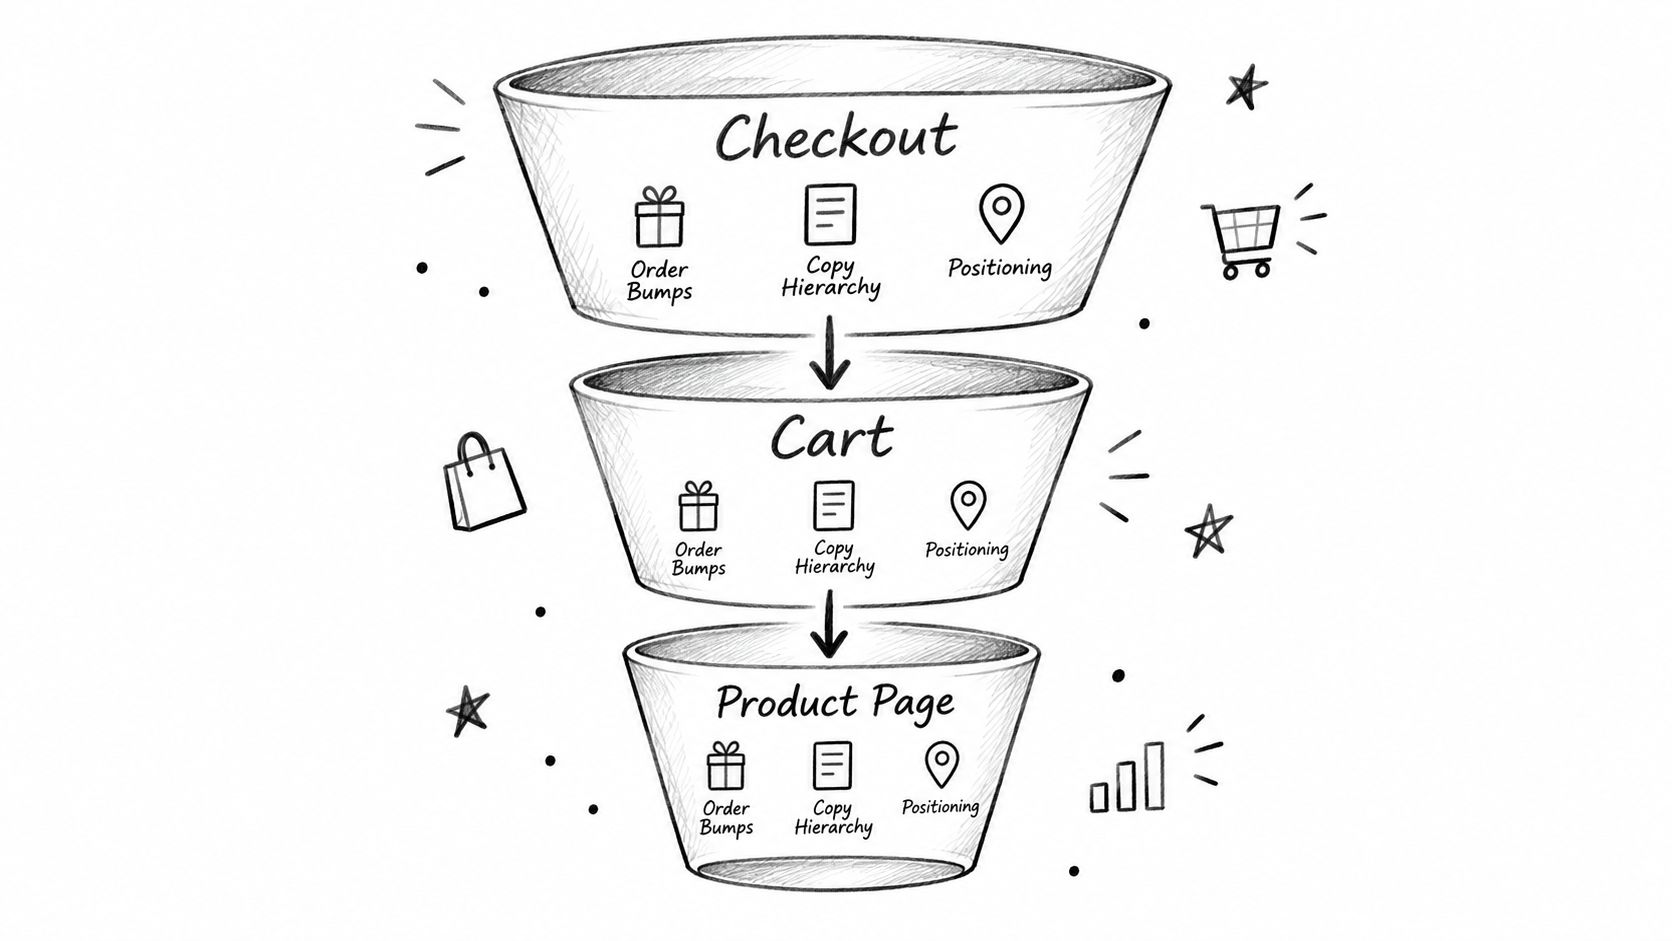
Start at checkout, where the offer must support the original decision rather than interrupt it. Use a clear order bump, a short benefit statement, and a visual hierarchy that keeps the primary product and total payable amount obvious. Payment-method coverage comes first because an accepted offer that can't be authorized isn't revenue.
Baymard reports average ecommerce cart abandonment at 70.19%, with unexpected extra charges accounting for 39% of surveyed US abandonment, forced account creation for 19%, a long or complicated process for 18%, and unavailable preferred payment methods for 10% (Baymard checkout research). An upsell should never conceal charges or add unnecessary steps to an already fragile checkout.
Match the lever to the stage
- Checkout: Test one relevant order bump, transparent pricing, and local payment options. Keep the original purchase path intact.
- Post-purchase: Use a one-click upgrade with tokenized credentials, a clear price anchor against the original order, and no repeated payment form.
- Lifecycle: Trigger email and SMS only after confirmed payment events. Segment by product, customer status, country, and subscription state.
- Routing: Send accepted payments through the processor path most likely to authorize them. Retry eligible failures without creating duplicate charges.
TagadaStudio can ship checkout and post-purchase variants without a developer hand-off. TagadaPay supports multi-processor routing, local methods, and smart retries. TagadaSend can trigger revenue-aware email and SMS from payment events. For broader funnel mechanics, Next Point Digital's funnel guide offers useful context.
A video walkthrough can reinforce the implementation sequence:
<iframe width="100%" style="aspect-ratio: 16 / 9;" src="https://www.youtube.com/embed/4nifWc6vVpo" frameborder="0" allow="autoplay; encrypted-media" allowfullscreen></iframe>
Use fewer, more relevant offers. More offer slots don't automatically create more customer value. Test the next logical product, quantity, tier, or renewal option, then remove placements that increase friction without improving incremental margin. See the one-click upsell implementation reference for the mechanics behind low-friction post-purchase flows.
Sample Calculations for Two Real Operator Cases
Consider a DTC brand with 1,000 eligible orders, 187 upsell acceptances, $45 average upsell revenue, and a $9 refund reserve per accepted upsell.
Gross acceptance is:
187 ÷ 1,000 × 100 = 18.7%
Gross upsell revenue is:
187 × $45 = $8,415
The refund reserve is:
187 × $9 = $1,683
Net upsell revenue is:
$8,415 minus $1,683 = $6,732
Net incremental revenue per eligible order is:
$6,732 ÷ 1,000 = $6.732
That is $6.732 per eligible order, or $7.93 per accepted upsell after the reserve. The first figure is the better operator metric because it includes every eligible order, not only customers who accepted.
A subscription or high-risk merchant can produce a higher headline acceptance rate and still lose money. Suppose the offer receives strong initial acceptance, but the payment path records declines, the same week's accepted offers generate chargebacks, and trial customers cancel before the first rebill. Without actual values, the correct conclusion is qualitative: the gross percentage is not enough to call the offer successful.
Track the accepted transaction through capture, refund, dispute, renewal, and cancellation. If the added margin cannot absorb those costs, the merchant should reduce the offer scope, improve consent and billing clarity, or remove the offer.
Experimentation Protocol and Guardrail Metrics
Begin with a falsifiable hypothesis. “A larger quantity offer will improve revenue” is weak. “A larger quantity offer shown to eligible purchasers after a specific product will increase incremental contribution margin without reducing primary payment capture” is testable.
Fix the denominator and eligibility rules before traffic enters the test. Randomize eligible purchasers into treatment and holdout groups, then define the minimum detectable effect and required sample before reviewing results. Don't stop a test because the first few days look exciting.
Guardrails that block false wins
Track the original purchase and the upsell together:
- Primary checkout conversion: Did the offer reduce completion of the original order?
- Payment authorization and capture: Did accepted offers become paid transactions?
- Refund rate: Did the added product create buyer regret or fulfillment problems?
- Chargeback rate: Did billing clarity or product fit create disputes?
- Subscription cancellation: Did the offer damage ongoing retention?
- 30-day and 90-day retention: Did the customer remain valuable after the initial transaction?
- Incremental contribution margin: Did the treatment outperform the holdout after all relevant costs?
Use split testing for clean causal comparisons. Consider a multi-armed bandit only after the event pipeline is reliable and guardrails are enforced. A bandit can allocate traffic efficiently, but it can't repair bad attribution or distinguish a click from captured revenue.
TagadaSend fits the loop when lifecycle messages need confirmed payment and retention events. The promotion rule is simple: promote the variant that improves incremental contribution margin per eligible order without breaching a guardrail. Teams looking for test design patterns can use these A/B testing examples, but the decision should remain anchored to net economics.
High-Risk and Subscription Guardrails
For high-risk and rebill merchants, an aggressive upsell isn't just a growth experiment. It can become a processor-risk event.
A Visa and Mastercard thresholds guide identifies a 1% chargeback-to-sales-transaction ratio and 100 chargebacks as a high-risk threshold. Its excessive threshold is 2% and 500 chargebacks (chargeback threshold guide). The same material identifies abusive free-trial policies and negative renewal options as practices that can contribute to movement from a standard threshold to a high-risk threshold.
Another summary describes an Excessive Chargeback Merchant category at 100 to 299 chargebacks per month with a 1.5% to 2.99% ratio, and a High Excessive Chargeback Merchant category above 300 chargebacks per month with a ratio of at least 3%. These thresholds make gross acceptance a dangerous optimization target for offers that obscure consent or create surprise rebills.
Subscription consent must survive the lifecycle
The US Federal Trade Commission's Negative Option Rule applies to negative-option programs across media. Before collecting billing information and charging consumers, sellers must provide material information, obtain unambiguously affirmative consent, and provide a simple cancellation mechanism that immediately stops recurring charges. Cancellation must be at least as easy as the method used to consent (FTC Negative Option Rule).
Record the offer shown, price, billing interval, trial or introductory period, consent event, transaction result, renewal outcome, cancellation request, refund, and dispute. Report initial acceptance separately from first rebill success and retained subscribers.
Risk control: Count a subscription upsell as successful only after captured payment, then judge it across refunds, disputes, cancellation, and retention.
Quick Reference and Cross-Linked Glossary
Pin this table to the dashboard or onboarding document. Each metric answers a different operating question.
| Metric | Formula | Owner | Tagada surface |
|---|---|---|---|
| Gross acceptance rate | Orders accepting at least one upsell ÷ eligible primary orders × 100 | Growth | TagadaStudio and checkout events |
| Net upsell revenue per eligible order | Upsell revenue minus upsell refunds ÷ eligible primary orders | Finance | TagadaPay capture and refund events |
| Incremental contribution margin | Treatment margin minus control margin | Finance and growth | TagadaStudio experiments and TagadaPay costs |
| Refund-adjusted revenue | Gross upsell revenue minus refunds | Finance and operations | Payment and refund events |
| Chargeback-adjusted revenue | Captured upsell revenue minus chargebacks and dispute costs | Risk | Payment, dispute, and routing events |
| Retention-adjusted LTV | Added customer value after retention, cancellations, and rebills | Lifecycle and finance | TagadaSend and subscription events |
Glossary
- Upsell: A higher-tier, larger-quantity, or upgraded version of the primary purchase. See Upsell Rate Definition and Core Formula.
- Cross-sell: A complementary product added to the original purchase. See Upsell Rate Definition and Core Formula.
- Order bump: A checkout offer presented alongside the primary purchase. See Benchmarks by Vertical and Offer Mechanism.
- One-time offer: A non-recurring offer presented during or after a transaction. See Benchmarks by Vertical and Offer Mechanism.
- Post-purchase upsell: An offer shown after the primary order, often using tokenized payment credentials. See Optimization Tactics Across the Funnel.
- Email-sequence upsell: A lifecycle offer delivered through email after a relevant payment or customer event. See Optimization Tactics Across the Funnel.
- Eligible order: A completed primary purchase included in the fixed denominator. See Upsell Rate Definition and Core Formula.
- Holdout group: Eligible purchasers who don't receive the tested offer. See Choosing the Right Measurement Approach.
- Guardrail metric: A safety measure that prevents an apparent winner from damaging checkout, payments, refunds, disputes, or retention. See Experimentation Protocol and Guardrail Metrics.
- Negative option: A program where continued service or billing occurs unless the customer takes action to stop it. See High-Risk and Subscription Guardrails.
Tagada provides checkout, one-click upsells, payment routing, server-side event tracking, subscription management, dunning, and revenue-aware email and SMS in one orchestration layer. Visit Tagada to map your upsell events from offer exposure through captured payment, refund, dispute, and rebill retention.