
Telehealth Company Benchmarks: Conversion Rate, AOV, CAC and Churn
What public data really says about telehealth conversion, CAC and churn, which numbers to distrust, and the funnel metrics to track instead.

Article summary
TL;DR
No public dataset with a stated method gives a conversion rate, AOV, CAC or churn rate for direct-to-consumer telehealth brands, as of November 2026. What exists is adoption data (5.51% of commercial medical claim lines were telehealth in Q1 2026), general ecommerce benchmarks, and vendor rules of thumb. Use them to rank your weak spots, then measure your own funnel.
- Telehealth made up 5.51% of commercial medical claim lines in Q1 2026, up from 5.01% in Q4 2025 (FAIR Health, June 2026).
- 18.39% of commercially insured patients had at least one telehealth service in Q1 2026.
- About 70% of online carts are abandoned across ecommerce (Baymard, 50 studies, September 2025).
- 25% of lost subscriptions are due to failed payments, according to Stripe (January 2024).
- One widely shared "2026 telehealth benchmarks" table says its numbers are "projected for 2026 based on aggregated historical trends", with no sample stated.
 ChatGPT
 Claude
 Perplexity
 Grok
On this page
These numbers feed the decisions in our hub on the best ecommerce platform for telehealth companies. Use them to find your weakest metric, then open the guide that fixes it.
The benchmarks at a glance
Every row shows who published the number, when, and how much weight it can carry.
| Metric | Value | Published by | Date | Reliability |
|---|---|---|---|---|
| Telehealth share of medical claim lines | 5.51% (5.01% in Q4 2025) | FAIR Health1FAIR Health, Quarterly Telehealth Regional Tracker, national, January to March 2026, published June 15, 2026 | Q1 2026 | High: commercial claims, excludes Medicare and Medicaid |
| Patients with a telehealth service | 18.39%; 18.6% urban, 10.3% rural | FAIR Health1FAIR Health, Quarterly Telehealth Regional Tracker, national, January to March 2026, published June 15, 2026 | Q1 2026 | High, same scope |
| Adults who used telemedicine in 12 months | 37.0% | CDC2CDC, NCHS Data Brief No. 445, Telemedicine Use Among Adults: United States, 2021, October 2022 | 2021 | High, but dated |
| Cart abandonment | 70.22% | Baymard3Baymard Institute, Cart abandonment rate statistics, updated September 22, 2025 | Sep 2025 | High: all ecommerce, not telehealth |
| Abandonment because the card was declined | 10% of US shoppers who abandoned | Baymard3Baymard Institute, Cart abandonment rate statistics, updated September 22, 2025 | Sep 2025 | High: all ecommerce |
| Lost subscriptions due to failed payments | 25% | Stripe4Stripe, on failed payments and lost subscriptions, January 23, 2024 | Jan 2024 | Medium: Stripe data, all subscriptions |
| Failed payment recovery | 53% to 71% at one merchant; "high 60s to low 70s is an achievable target" | Recurly5Recurly, Failed payment recovery: a data-based strategy, April 30, 2026 | Apr 2026 | Medium: two cases |
| Post-purchase upsell acceptance | 4.7% on average | ReConvert6ReConvert, The impact of post-purchase upselling (2023 data) | 2023 data | Medium: Shopify stores, all categories |
| LTV:CAC | 3:1 as a "baseline" | Bask Health7Bask Health, LTV vs CAC, read November 2, 2026 (vendor content) | 2026 | Low: vendor rule of thumb, no data |
Fig. 1How much weight each number can carry
- Telehealth share of medical claim lines5.51% (5.01% in Q4 2025), FAIR HealthHigh: commercial claims
- Patients with a telehealth service18.39%; 18.6% urban, 10.3% rural, FAIR HealthHigh, same scope
- Adults who used telemedicine in 12 months37.0%, CDCHigh, but dated
- Cart abandonment70.22%, BaymardHigh: all ecommerce, not telehealth
- Lost subscriptions due to failed payments25%, StripeMedium: Stripe data, all subscriptions
- Failed payment recovery53% to 71% at one merchant, RecurlyMedium: two cases
- Post-purchase upsell acceptance4.7% on average, ReConvertMedium: Shopify stores, all categories
- LTV:CAC3:1 as a baseline, Bask HealthLow: vendor rule of thumb, no data
High for adoption, low for vendor rules of thumb.
Watch out
Conversion rates, CAC and churn rates labeled "telehealth" circulate widely. The most visible table says its figures are projections and gives no sample size or data provider8CUFinder, Telehealth marketing benchmarks 2026, methodology note, read November 2, 2026. If a number has no sample, date and definition, do not set targets on it.
Why telehealth benchmarks are so thin
Telehealth brands are private, regulated and young. Four reasons keep public numbers scarce.
Few public companies
Most DTC telehealth brands do not publish funnel data.
Mixed models
A one-off consultation, a monthly treatment plan and a membership have nothing in common on AOV or churn.
A clinical step in the funnel
Part of your "conversion" depends on clinician approval, which no ecommerce benchmark measures.
Vendors fill the gap
Most "benchmarks" come from platforms and agencies, using their clients or projections.
The right use of the numbers above is to compare your own metrics to the closest reliable range, not to a telehealth average that does not exist.
Market data: how many patients use telehealth
Adoption data is the one area with primary, dated sources.
| Indicator | Value |
|---|---|
| Telehealth share of medical claim lines, US, commercial | 5.51% in Q1 2026, 5.01% in Q4 2025 (FAIR Health)1FAIR Health, Quarterly Telehealth Regional Tracker, national, January to March 2026, published June 15, 2026 |
| Patients with at least one telehealth service | 18.39% in Q1 2026, 17.30% in Q4 2025 (FAIR Health)1FAIR Health, Quarterly Telehealth Regional Tracker, national, January to March 2026, published June 15, 2026 |
| Urban vs rural patients | 18.6% vs 10.3% (FAIR Health)1FAIR Health, Quarterly Telehealth Regional Tracker, national, January to March 2026, published June 15, 2026 |
| US adults who used telemedicine in the past 12 months | 37.0% in 2021 (CDC, National Health Interview Survey)2CDC, NCHS Data Brief No. 445, Telemedicine Use Among Adults: United States, 2021, October 2022 |
Fig. 2Patients with at least one telehealth service, Q1 2026
Rural patients use telehealth far less than urban ones.
This tells you patients are used to remote care. It does not tell you how a paid DTC funnel converts.
The telehealth funnel metrics to track
A telehealth funnel has steps a normal store does not. Track each one with the same definition every month.
| Metric | Formula | What it tells you |
|---|---|---|
| Quiz start rate | Quiz starts ÷ landing page sessions | Whether the offer and page earn the click |
| Quiz completion rate | Completed quizzes ÷ quiz starts | Whether the intake is too long or confusing |
| Checkout conversion | Card holds ÷ completed quizzes | Price, trust and payment friction |
| Approval rate | Approved cases ÷ submitted cases | Fit between your targeting and clinical criteria |
| Capture rate | Captured holds ÷ approved cases | Expired holds and declines at capture |
| First refill rate | Patients billed a second time ÷ patients shipped once | The real start of lifetime value |
| Failed renewal recovery | Recovered renewals ÷ failed renewals | Dunning quality |
Fig. 3Seven steps, from the session to the first refill
- Quiz start rate: quiz starts ÷ landing page sessions.
- Quiz completion rate: completed quizzes ÷ quiz starts.
- Checkout conversion: card holds ÷ completed quizzes.
- Approval rate: approved cases ÷ submitted cases.
- Capture rate: captured holds ÷ approved cases.
- First refill rate: patients billed a second time ÷ patients shipped once.
- Failed renewal recovery: recovered renewals ÷ failed renewals.
The approval rate is the step ecommerce benchmarks never measure.
Same definition every month.
The approval rate is the metric ecommerce teams forget. A cheap ad audience that clinicians decline is not cheap. Fixing low-converting steps is covered in why your telehealth company gets traffic but no sales.
Conversion and checkout
No telehealth-specific conversion rate with a method is public. The checkout part behaves like ecommerce, so the general data applies.
- Abandonment: 70.22% of carts are abandoned across ecommerce3Baymard Institute, Cart abandonment rate statistics, updated September 22, 2025.
- Declines: 10% of US shoppers who abandoned did so because their card was declined3Baymard Institute, Cart abandonment rate statistics, updated September 22, 2025. On a restricted vertical, declines matter more.
- Your real rate: measure conversion from completed quiz to card hold, not from session to sale. The clinical step distorts the second.
Page and offer structure are in the telehealth sales funnel.
AOV: depends on the model
There is no published telehealth AOV. A consultation, a monthly plan and a 3-month plan produce very different first orders.
- Compare like with like: first-order value per model, then 90-day revenue per patient.
- Add-ons: post-purchase upsells convert at 4.7% on average across Shopify stores6ReConvert, The impact of post-purchase upselling (2023 data), a general figure, not a telehealth one.
How to raise it without pressure tactics: how to increase AOV for a telehealth company.
CAC and LTV: measure fully loaded
Public CAC figures for DTC telehealth do not exist with a method. Build yours from your own data.
- CAC: all acquisition costs (media, creative, agency, promos) ÷ new paying patients in the period. Count only captured payments, not holds.
- LTV: contribution margin per patient over the cohort's life, after clinician, pharmacy, payment and refund costs.
- Payback: CAC ÷ monthly contribution margin per patient.
Bask Health, a telehealth software vendor, calls 3:1 LTV:CAC a "baseline" and payback beyond 6 months fragile7Bask Health, LTV vs CAC, read November 2, 2026 (vendor content). Treat it as a rule of thumb. The full method is in LTV and CAC for a telehealth company.
Churn and failed payments
No reliable public churn rate exists for telehealth subscriptions. Two general figures help frame it.
| Signal | Value |
|---|---|
| Lost subscriptions caused by failed payments | 25% (Stripe)4Stripe, on failed payments and lost subscriptions, January 23, 2024 |
| Recovery achievable with good dunning | "high 60s to low 70s" percent (Recurly)5Recurly, Failed payment recovery: a data-based strategy, April 30, 2026 |
Part of telehealth churn is involuntary: an expired card, a declined renewal, a refill billed before the pharmacy ships. See subscriptions and churn and failed payment recovery. On the payment side, declined payments for telehealth companies explains why renewals fail.
How to build your own benchmark
Your history is the only benchmark that fits your model.
- Fix definitions for each metric in the funnel table above.
- Split by model and channel: one-off consults vs plans, paid social vs search vs email.
- Track monthly cohorts from first capture, not first visit.
- Compare to the closest reliable range in the first table, and say where it comes from.
- Pick the weakest step and fix that one first.
Fig. 4A monthly benchmark sheet, per channel
- Quiz start rate
- Whether the offer and page earn the click
- Quiz completion rate
- Whether the intake is too long or confusing
- Checkout conversion
- Price, trust and payment friction
- Approval rate
- Fit between your targeting and clinical criteria
- Capture rate
- Expired holds and declines at capture
- First refill rate
- The real start of lifetime value
- Failed renewal recovery
- Dunning quality
Template, no data.
Fill it from your own cohorts, one sheet per channel.
How Tagada helps
Funnel and payment data you can export
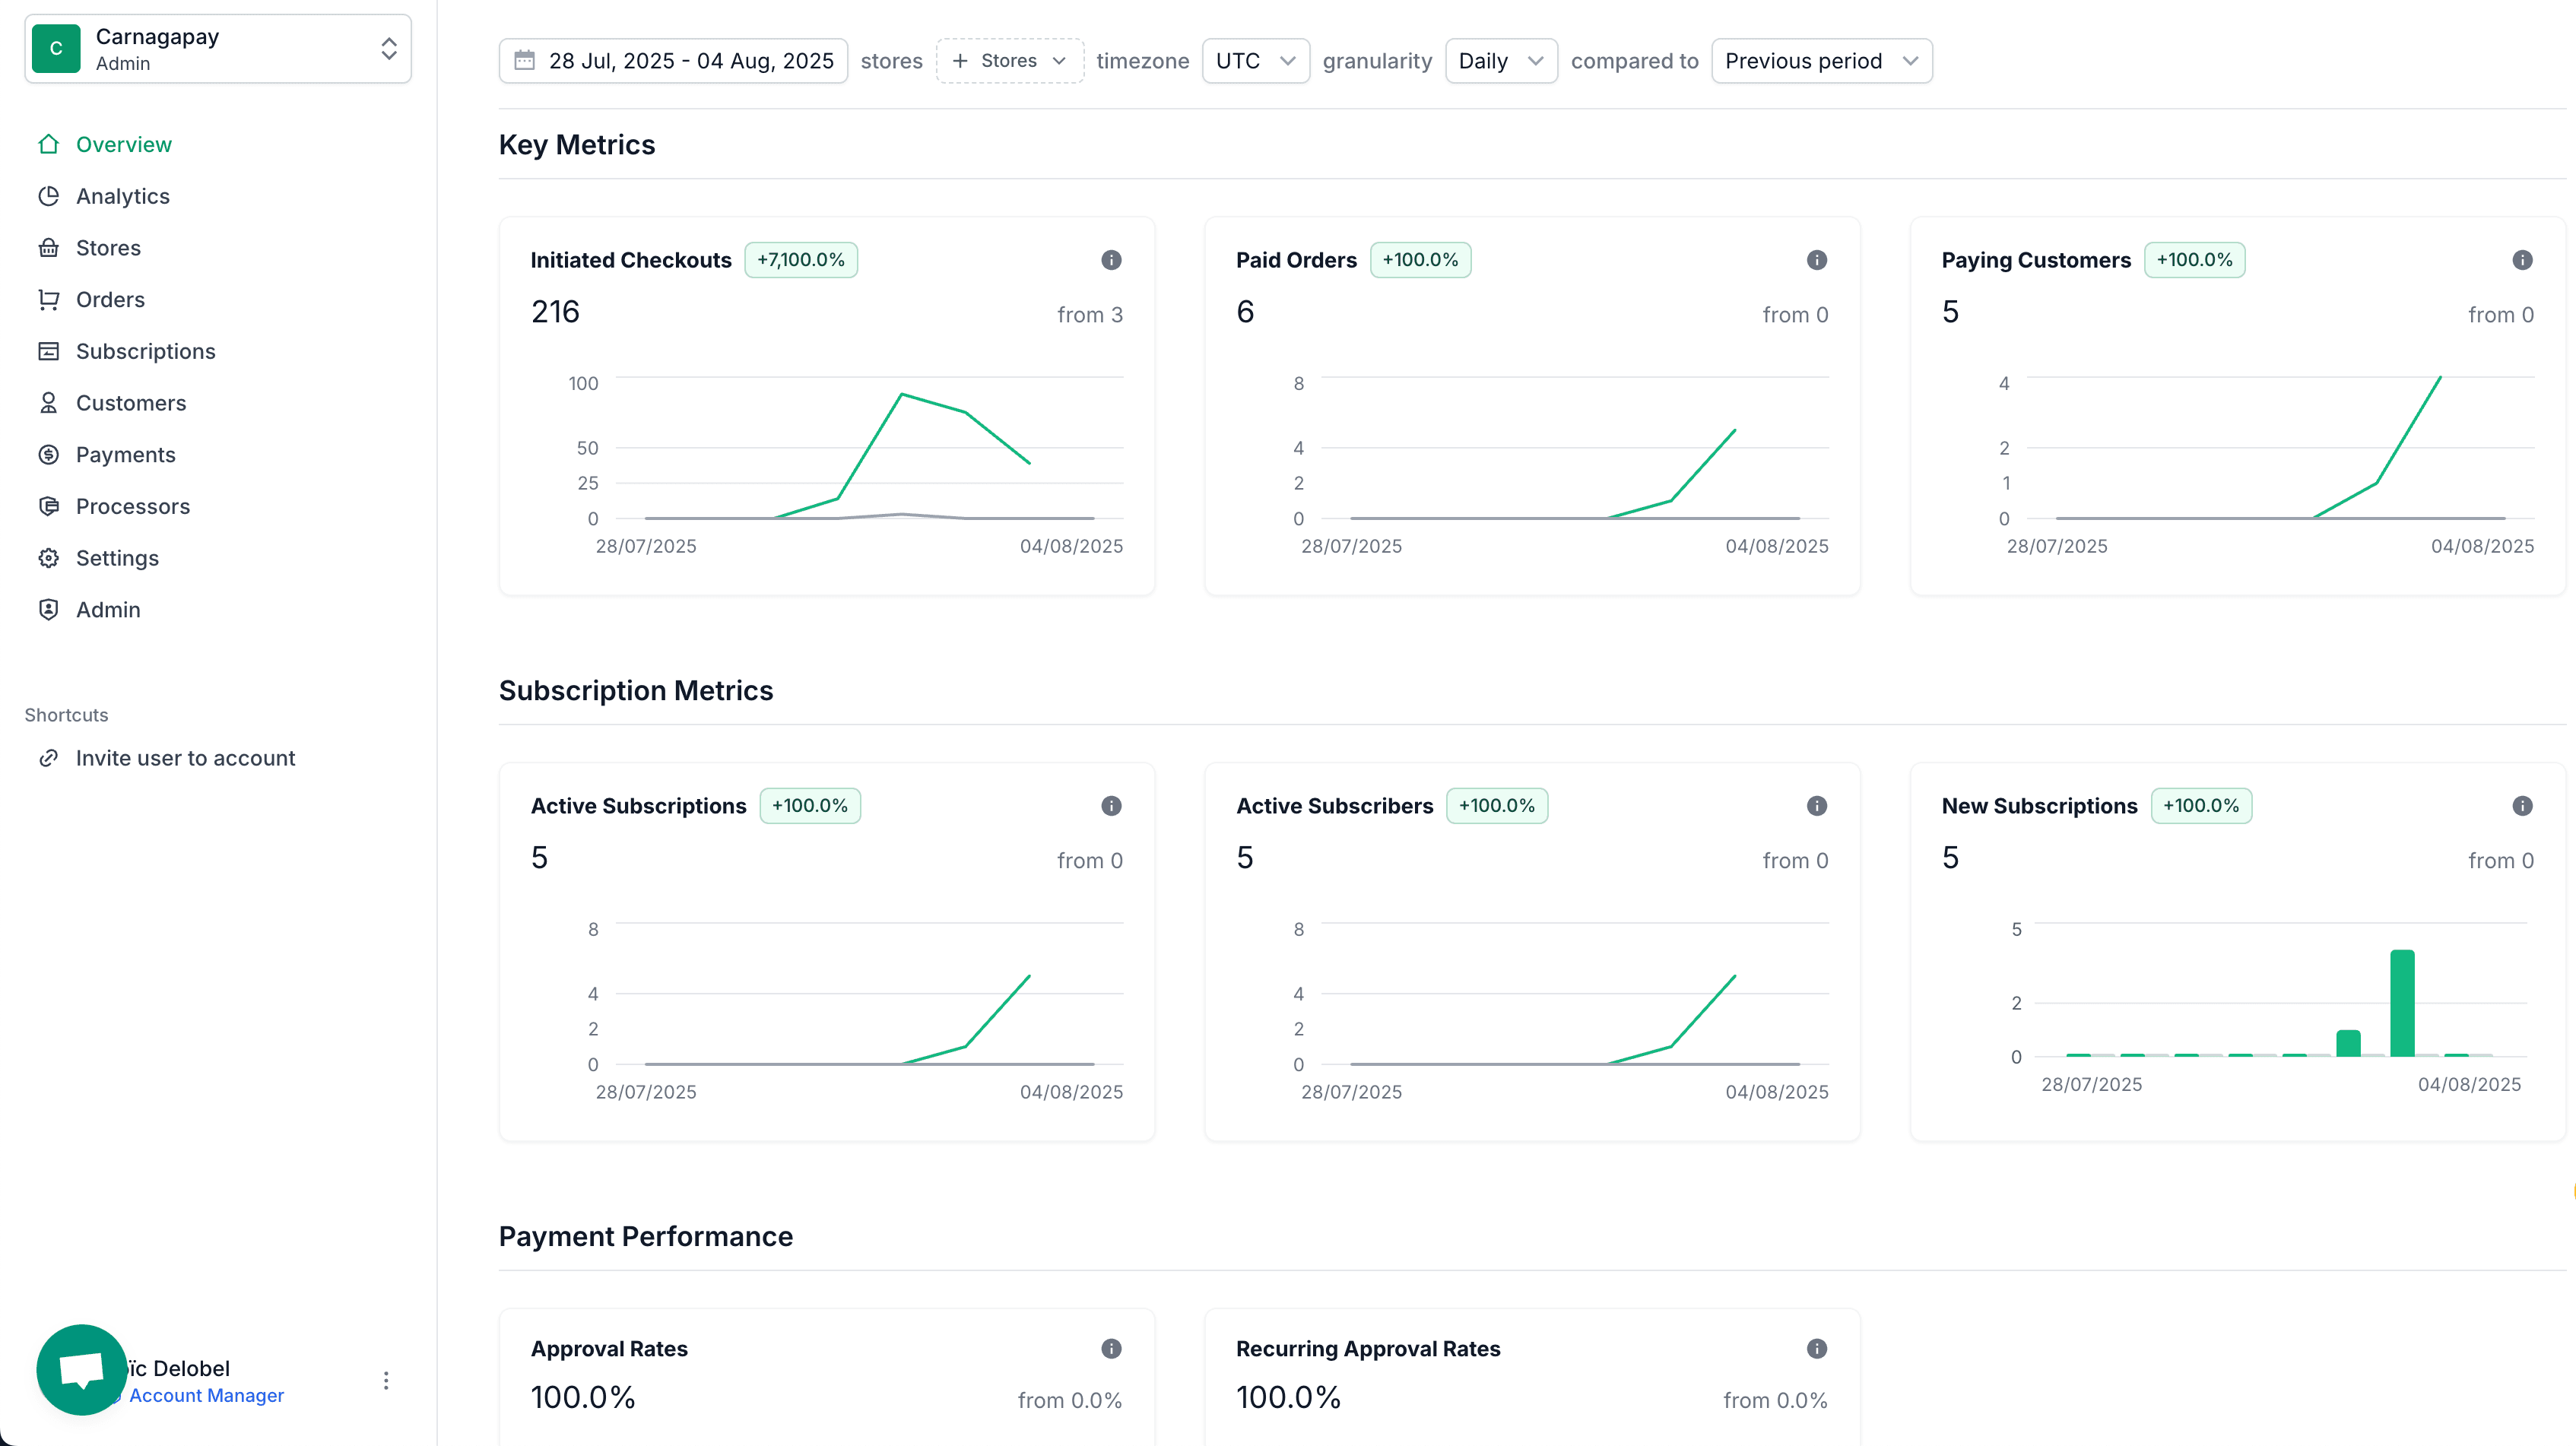
Tagada keeps checkout, subscriptions and payment data together, with TagadaPay behind each charge and a vault you keep: "Your PCI-tokenized cards, your customer profiles, your subscription data, all portable."11TagadaPay, homepage, read November 2, 2026
- Routing across TagadaPay and processors such as Stripe, NMI and Airwallex, with a cascade to another processor when one is down or times out
- Fraud filters: "Native 3DS2, device intelligence, and rules engine: approve real customers, block the rest."
- Your data, exportable: "Export your vault, cards, and customers anytime."
Building the whole telehealth brand? With Tagada Rx, every funnel step sits in "Eight modules, one data model, one dashboard", the card is captured only once a doctor approves9Tagada Rx, tagada.io/rx, read November 2, 2026, and declined, cancelled and errored cases never rebill10Tagada docs, Rx how it works, read November 2, 2026. US patients only, by selection.
Frequently asked questions
What is a good conversion rate for a telehealth company?
What is a good LTV to CAC ratio for telehealth?
What is the average churn rate for telehealth subscriptions?
How many Americans use telehealth?
Which metric matters most for a telehealth brand?
Sources
Checked November 2, 2026- FAIR Health, Quarterly Telehealth Regional Tracker, national, January to March 2026, published June 15, 2026
- CDC, NCHS Data Brief No. 445, Telemedicine Use Among Adults: United States, 2021, October 2022
- Baymard Institute, Cart abandonment rate statistics, updated September 22, 2025
- Stripe, on failed payments and lost subscriptions, January 23, 2024
- Recurly, Failed payment recovery: a data-based strategy, April 30, 2026
- ReConvert, The impact of post-purchase upselling (2023 data)
- Bask Health, LTV vs CAC, read November 2, 2026 (vendor content)
- CUFinder, Telehealth marketing benchmarks 2026, methodology note, read November 2, 2026
- Tagada Rx, tagada.io/rx, read November 2, 2026
- Tagada docs, Rx how it works, read November 2, 2026
- TagadaPay, homepage, read November 2, 2026
Tagada
Find your weakest funnel step, then fix that one
Funnels, one-click upsells, subscription billing and payment routing, on one customer record.
- 01Create your free account
- 02Connect your store or build a checkout
- 03Launch funnels, upsells and subscriptions